
The Emissions of The Food Industry

A while back I was asked what motivates me to build a company to tackle climate change. My biggest personal driver was never climate change itself. It was the feeling that we have lost touch with the food we eat. I grew up in a city which, while close to nature, was not where food was produced. My parents had a small garden and I still like working in a garden today. But even what some might call urban farming has very little to do with what is happening in the bigger world of food.
All humans on this planet have to eat, and what we eat is directly linked to one of the oldest economies in the world. No matter whether you study life cycle impacts in agriculture or you are simply a consumer buying food in a supermarket, we are all part of this system.
What we put in is what we get out
Back in 1961, the average use of fertilizer (nitrogen, phosphorus and potassium) was around 21 kilograms per hectare of cropland globally. By 2022, this had risen to around 113 kilograms per hectare according to FAO data. That is an increase of more than 430% in around sixty years.
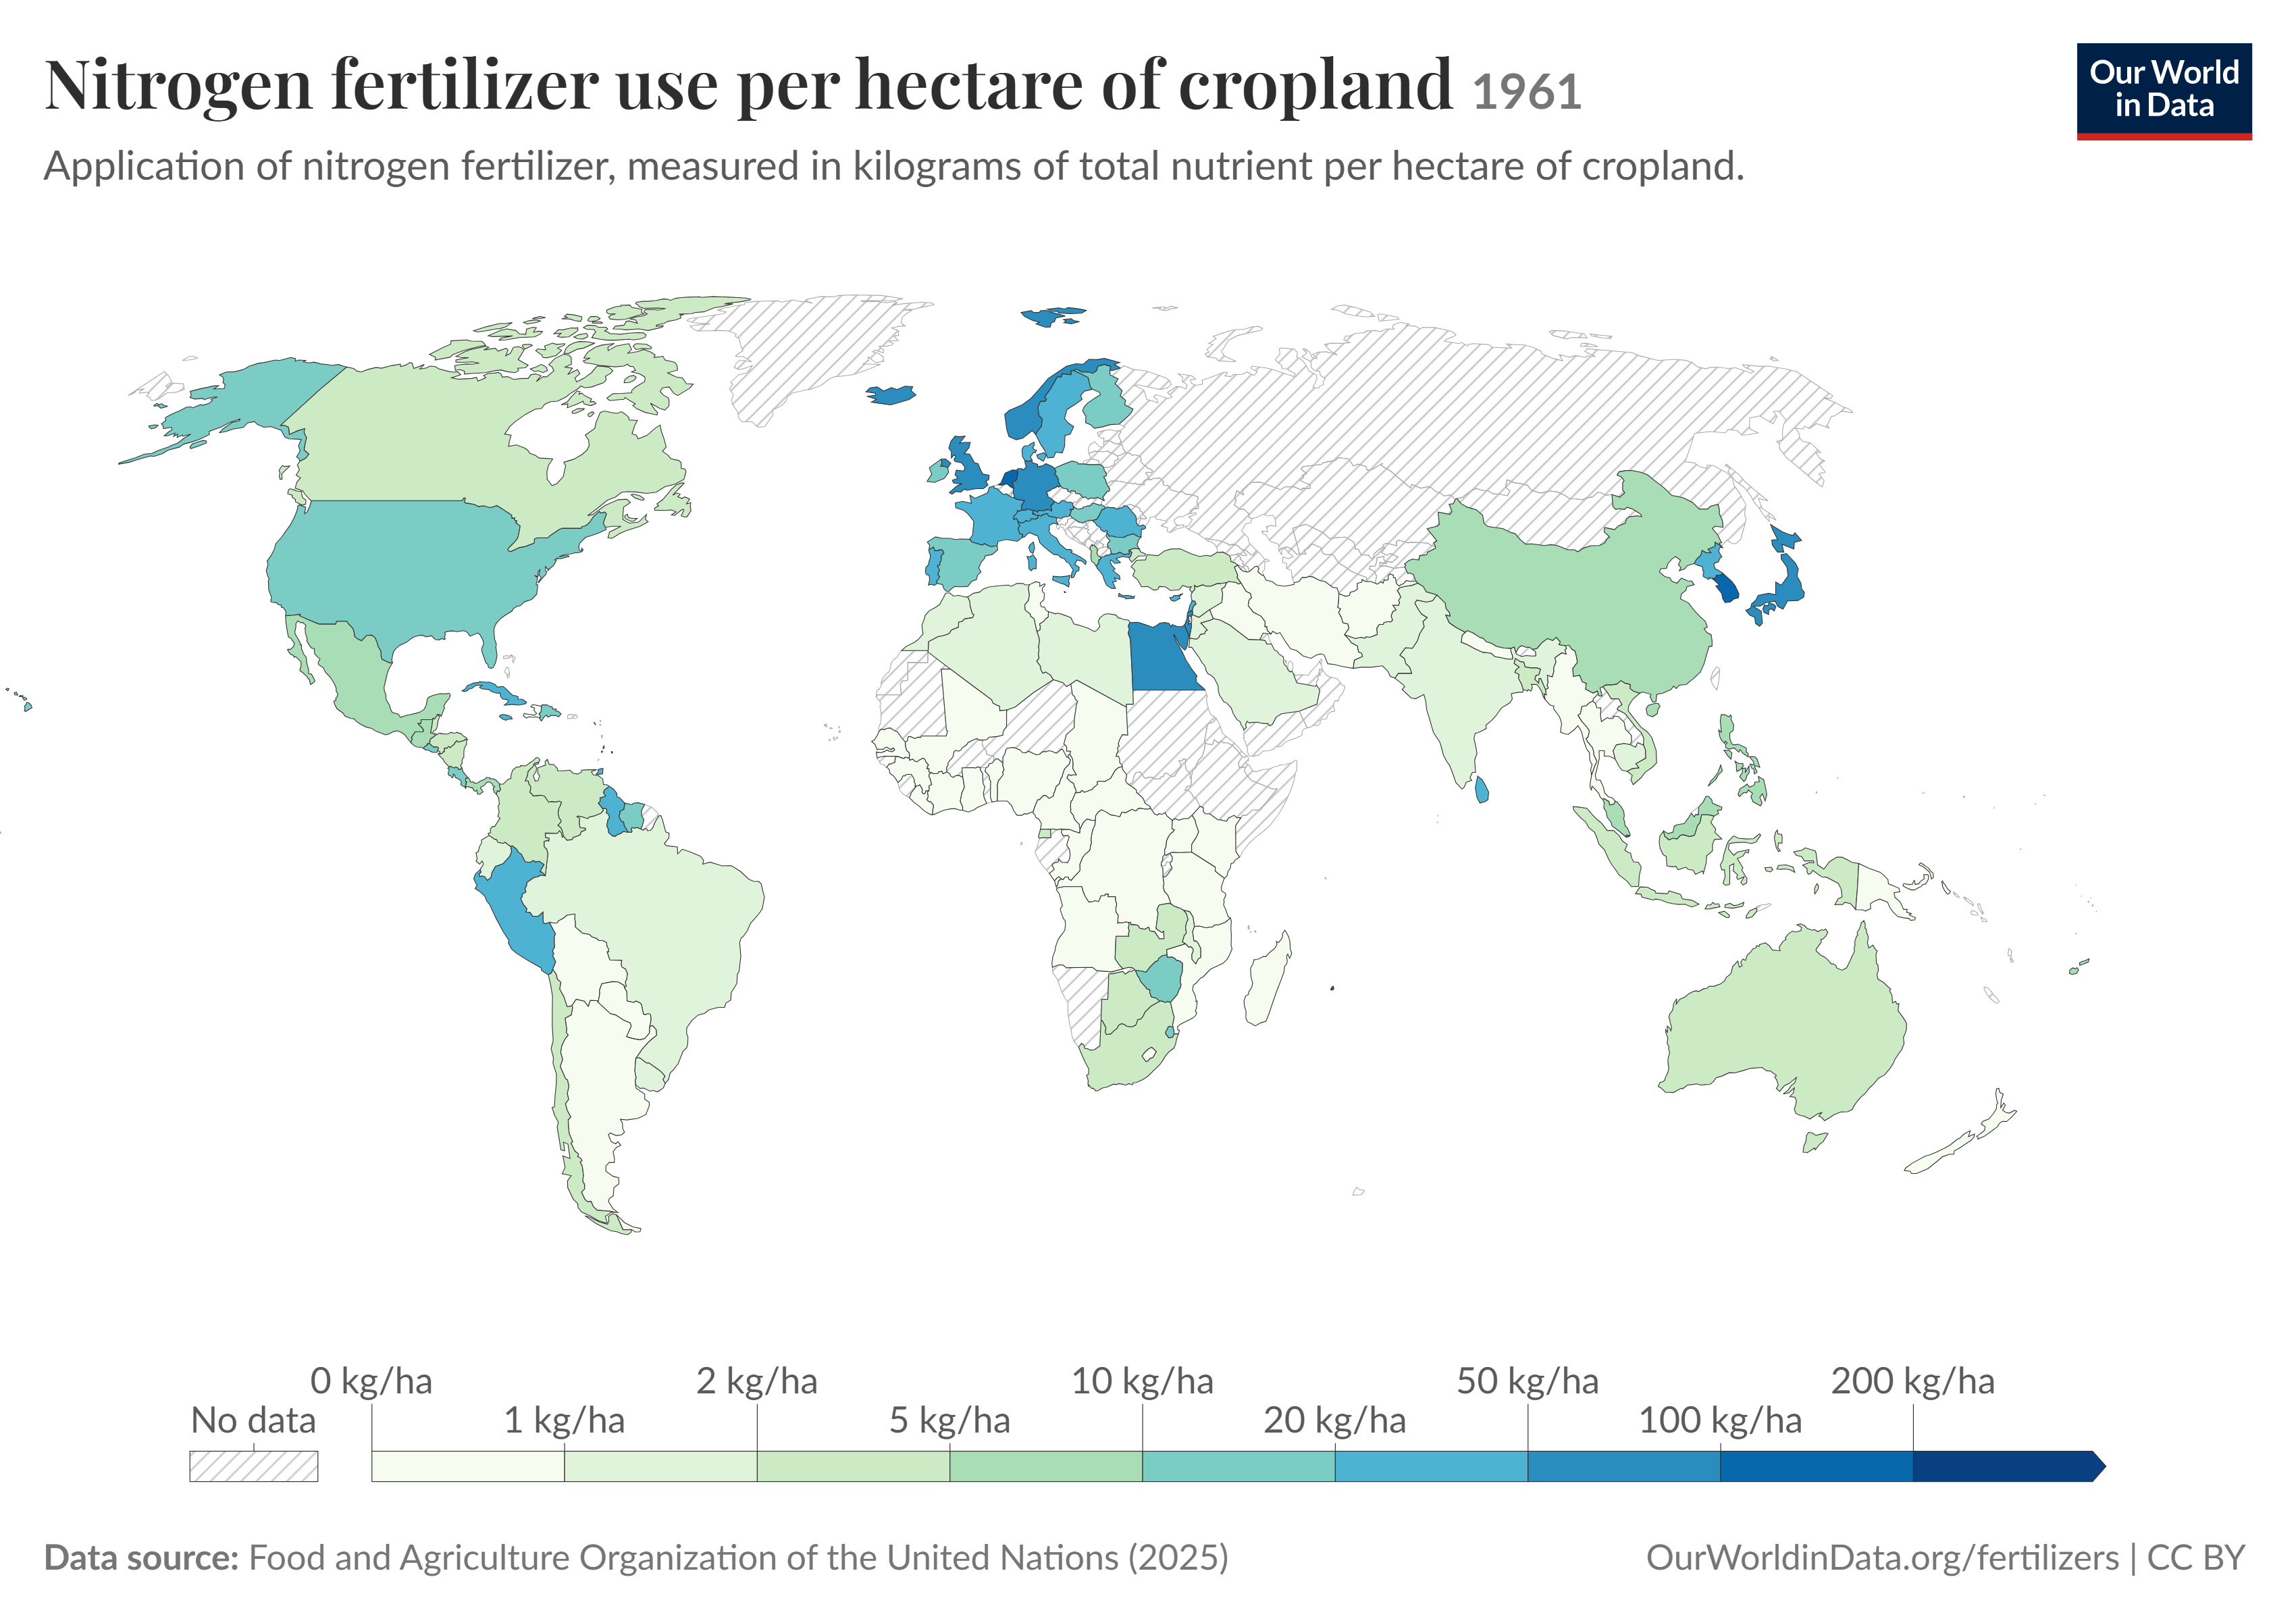
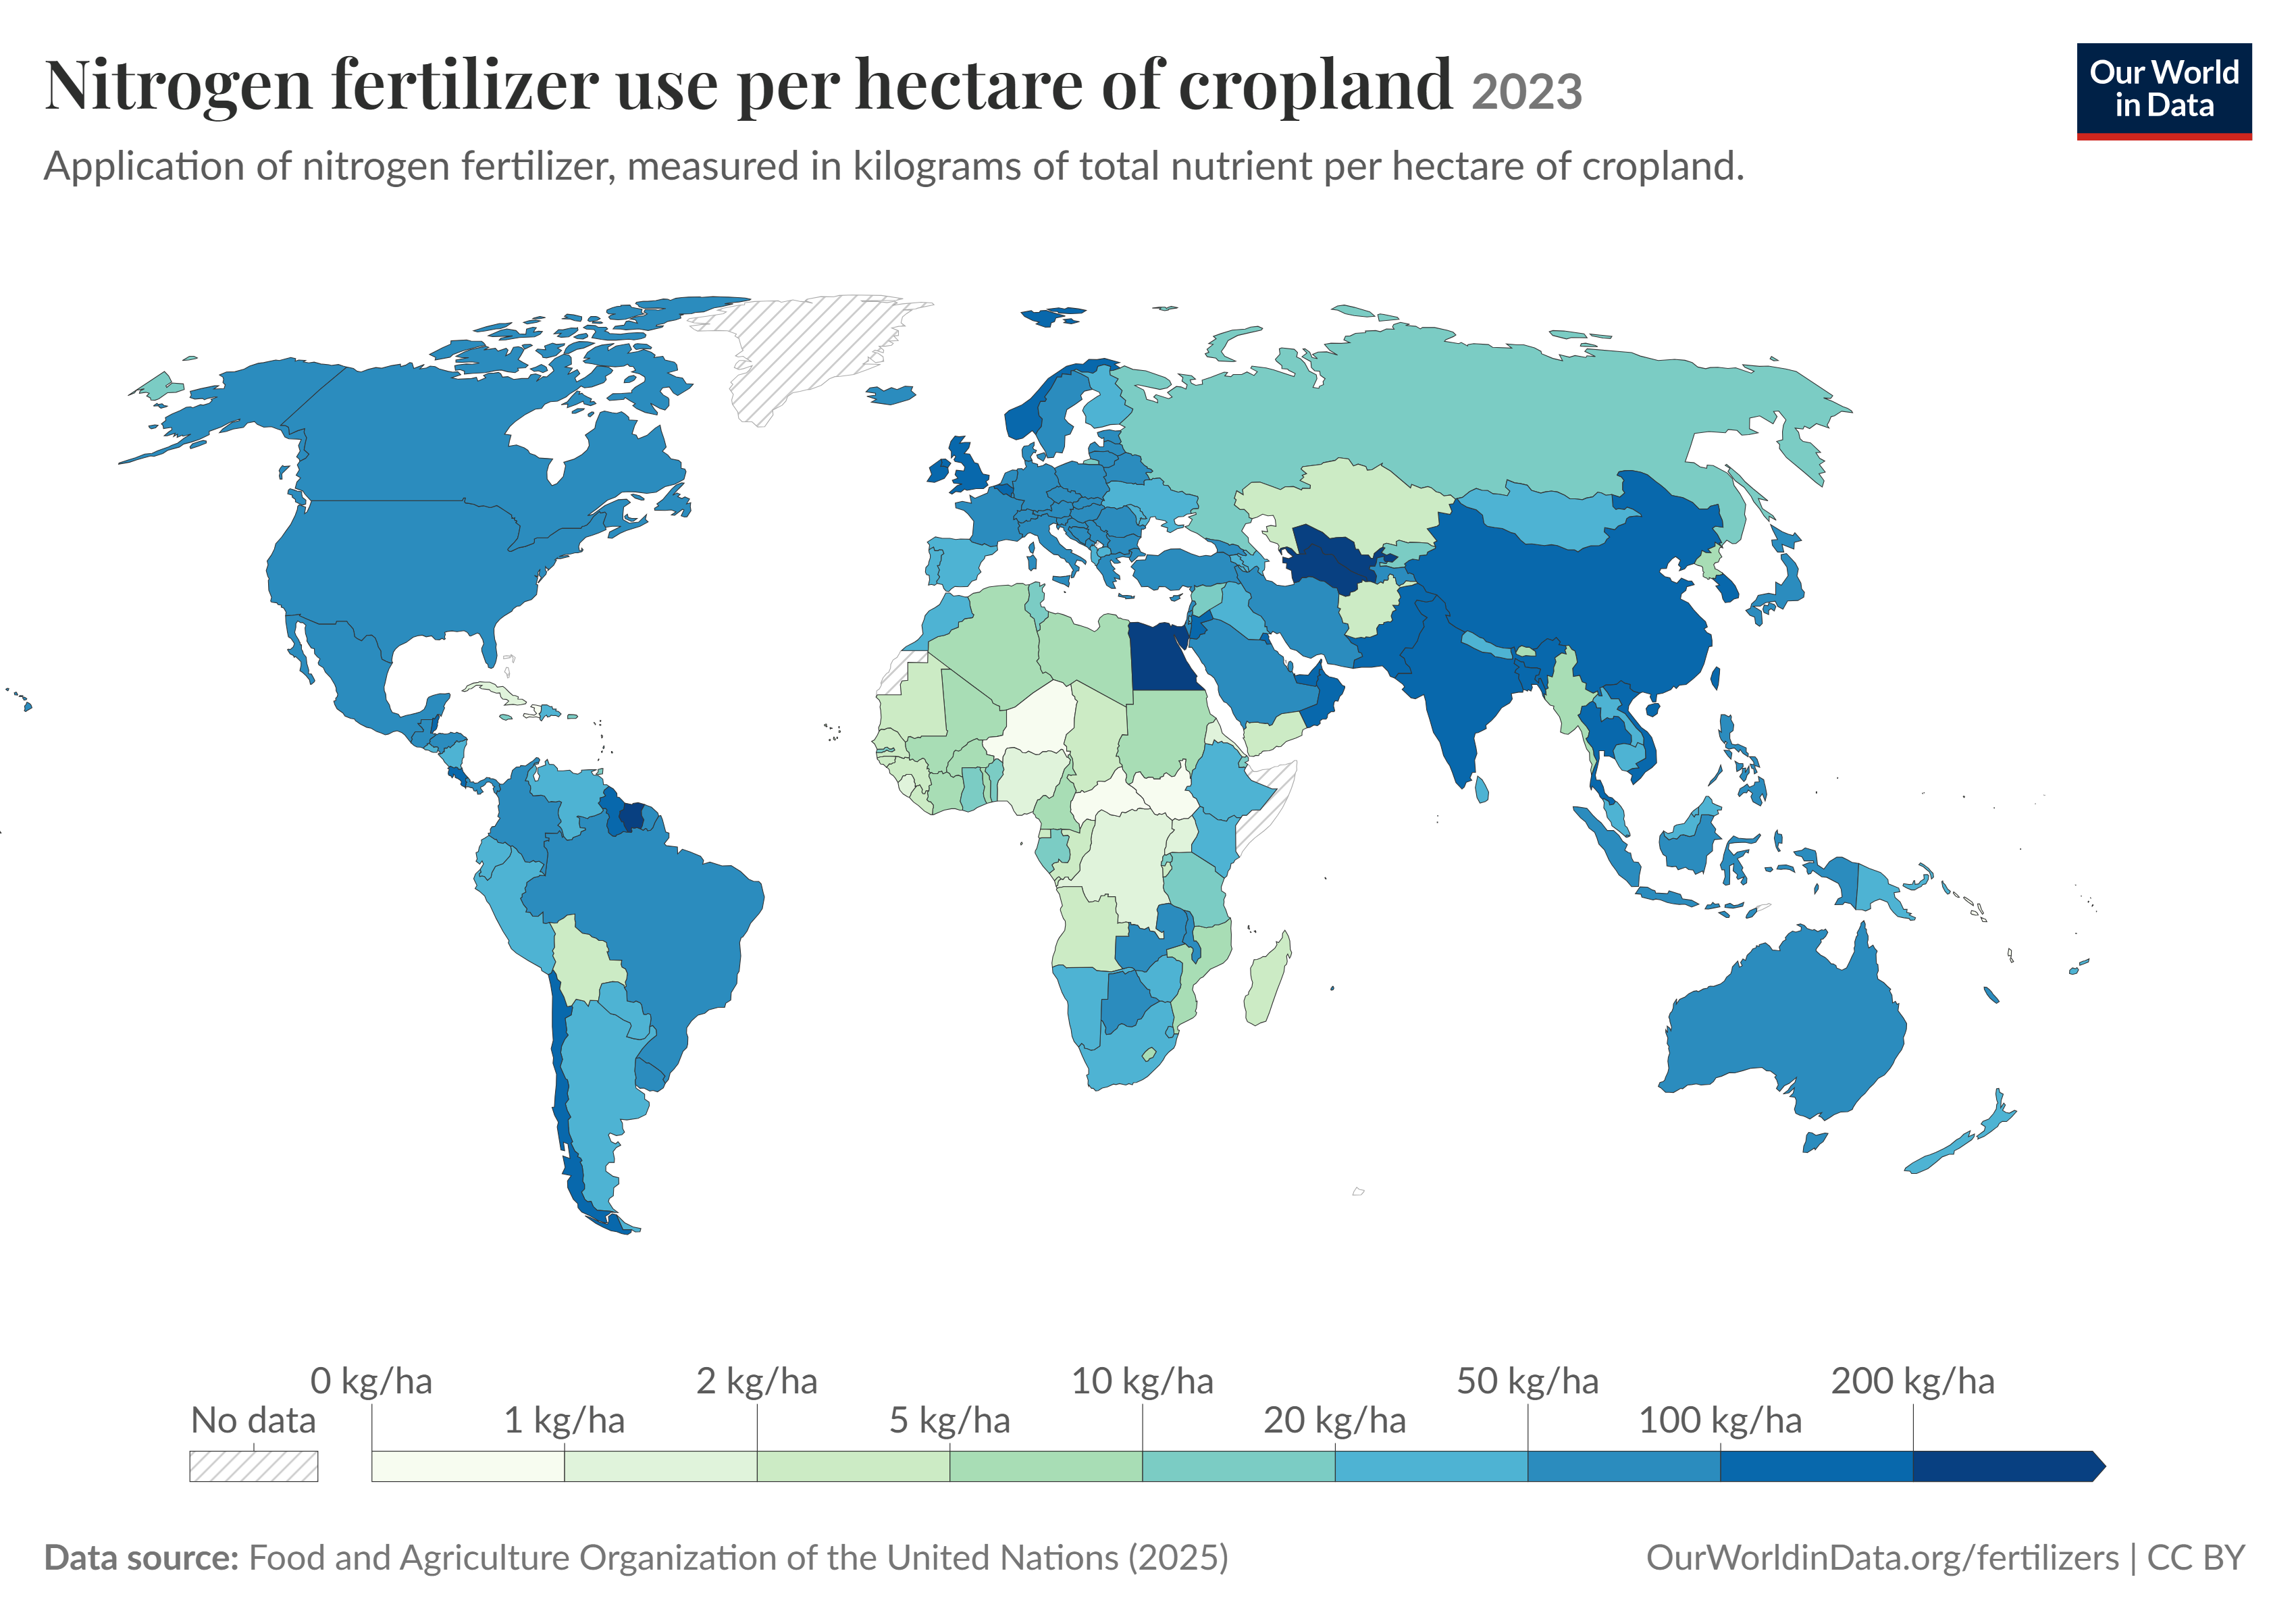
The use of fertilizers was one of the biggest changes in modern agriculture. It allowed us to produce significantly more food from the same amount of land. Take wheat in the United Kingdom. In 1961, one hectare produced around 3.5 tonnes of wheat. Within a few decades that had more than doubled, and UK wheat yields today are around 7–8 tonnes per hectare.
So fertilizer itself is not the problem. The important question is how efficiently we use it. If a farmer applies more nitrogen and gets significantly more food from the same field, the emissions are spread across more kilograms of product. But there is a limit. Crops can only absorb a certain amount of nutrients. What they don't absorb can be lost into water, soil or the atmosphere.
This is why nutrient-use efficiency matters. It describes, in simple terms, how much of the nutrients we put into the agricultural system actually end up in the crops we harvest. Too little fertilizer can limit yields. Too much means we are putting resources into the system that the crop cannot use, leading to unnecessary emissions and pollution.
This is also one way to understand life cycle assessment. A very simplified calculation could look something like this:
(fertilizer production emissions + emissions from the soil + energy + other inputs) / yield = emissions per kg of product
Of course, a real life cycle assessment is much more complicated. But the basic idea remains the same: what do we put into the system, what comes out of it, and what happens in between? Increasing agricultural inputs helped us dramatically increase yields. But once yield improvements start slowing down, simply adding more inputs does not necessarily make the system more productive.
Global Food Supply Chains
It is not only how we produce food that has changed. It is also where our food comes from. Despite us serving customers in Europe, many of the goods they source are produced in Asia. For one of our customers, for example, the largest share of emissions in their supply chain originates in China.
This matters because the same product can have a very different footprint depending on where and how it was produced. Take something as simple as dried onions.
The onions could be grown in India or Germany. The farmer might apply different amounts and types of fertilizer. The electricity used to produce that fertilizer might come from different energy sources. The onions then have to be dried, which requires energy again. One factory might use natural gas, another electricity, and that electricity might come from coal, solar, nuclear or wind.
Comparison of Dried Onions Consumed in Germany (Niatsu Database)
0.0
kgCO2e/kg
Onions Produced and Dried in Germany + No Transport
0.0
kgCO2e/kg
Onions Produced and Dried in India + Transport to Germany
In the end, both products arrive at a food company labelled simply as dried onions.
But environmentally, they are not necessarily the same product. Interestingly, transport is often not as relevant as one might think. Globally, transport represents only around 5% of food-system emissions. What happens on and around the farm: land use, fertilizer, soil emissions and the type of food being produced, often matters much more.
So how big is the food system's footprint really?
If you add it all up: farming, fertilizer production, land-use change, processing, packaging, transport and waste, estimates suggest food systems are responsible for somewhere between roughly a quarter and a third of global greenhouse gas emissions. This number is remarkable for a simple reason: unlike flying or driving, eating is not optional. We cannot decarbonize food by doing less of it. We can only change how we produce it, where we produce it and what we choose to put on our plates. And this is exactly why the fertilizer story from the beginning matters.
The footprint of our food is not caused by one villain. It is the sum of millions of decisions along global supply chains: how much fertilizer a farmer uses, how that fertilizer was produced, whether onions are dried in India or Germany, whether a greenhouse is heated with gas, or what electricity powers a processing facility. None of these decisions show up on the front of a product label. Most of them are invisible even to the companies selling the final product.
Losing touch, measured in numbers
I started this post by saying that my biggest driver was never climate change itself, but that we have lost touch with the food we eat. To me, these two things are increasingly the same problem.
Sixty years ago, the connection between a field and a plate was much shorter. Today it can run through fertilizer plants, farms, processing facilities, ocean freight and factories across three continents. No consumer and honestly, almost no food company can understand that supply chain by intuition anymore. You cannot reconnect with a system you cannot see.
But you can measure it. That is what life cycle assessment does at its core: it makes the invisible parts of our food system visible again, in numbers. And once you see the numbers, the system stops being abstract.
It becomes a list of concrete decisions that can be changed.