
The Emissions You Don’t See: Understanding Land Use Change

What is land use change?
When we talk about the carbon footprint of palm oil, we often think about how it is produced or transported. But the largest emissions often occur much earlier, when forests are cleared to make space for plantations. These emissions are known as land use change (LUC), and they are often the hardest to see and quantify.
Land use change refers to the conversion of natural land, such as forests or peatlands, into agricultural land. This process releases large amounts of carbon because natural ecosystems store carbon in vegetation and soils. When land is cleared, for example through deforestation, burning, or drainage, this stored carbon is released into the atmosphere as carbon dioxide. As a result, land use change is often one of the most significant contributors to emissions in crop production systems.
Why is it hard to measure?
A lot of information is needed to trace back and calculate such emissions. When did the conversion occur? Which crop is being cultivated? What type of land was converted, and over what area? How much carbon was stored in the original vegetation and soils?
Answering these questions requires combining data from many different sources, which are often incomplete and inconsistent. As a result, assumptions are needed to fill the gaps. Once the data has been assembled, different methodological approaches can be used to combine it and estimate emissions.
Frameworks such as the Greenhouse Gas Protocol provide general guidance for land use change accounting, but their remaining flexibility can lead to significantly different emissions estimates. More recently, methodologies have been developped to improve consistency, using geospatial datasets to produce globally consistent emissions factors across crops and regions. This provides a step-by-step methodology that adapts to the available data, with fallback data sources when information is missing, ensuring a consistent basis for all users.
How are LUC emissions calculated?
The calculation depends on the level of traceability in the value chain. Different approaches are used depending on whether the origin of the product can be linked to a specific field and when land conversion occurred. Here, we focus on the case where the exact sourcing location of the crop is unknown.
In this case, geospatial datasets are used to estimate land use change at a regional level. In practice, this involves:
- Defining cropland areas and their expansion using crop maps
- Identifying forest conversion using satellite-based forest loss data
- Estimating carbon release based on regional carbon stock data
- Allocating emissions to specific crops based on their share of cropland expansion
Land use change emissions are typically assessed over a 20-year period, allowing the initial carbon release from land conversion to be amortised over time and avoiding large year-to-year fluctuations.
Using this approach, we estimated land use change emissions for palm oil production in Indonesia. The map below shows the spatial distribution of these emissions across the country.
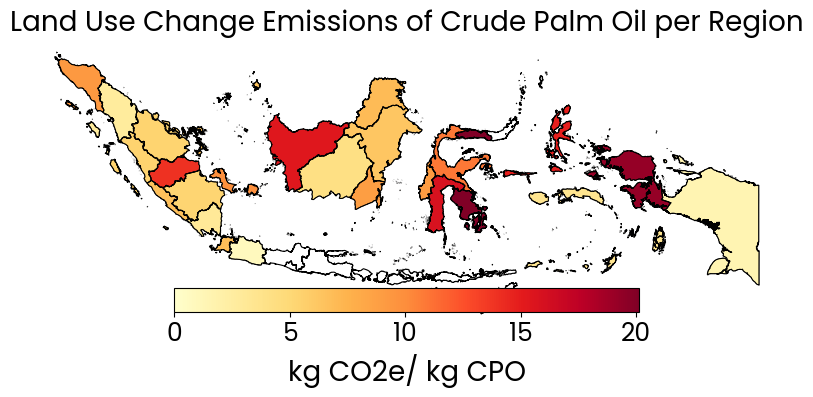
The results highlight strong regional differences. Areas with recent forest conversion, particularly in regions with high carbon stocks such as tropical forests and peatlands, show significantly higher emissions. In contrast, regions with less recent or less intensive land conversion exhibit lower values.
More broadly, land use change emissions are highly dependent on location and land history. The same crop can have very different impacts depending on what type of land was converted and when this conversion occurred. This makes land use change one of the most variable and context-dependent components of agricultural emissions.
At the same time, current accounting approaches are highly sensitive to the chosen time horizon. Regions where agricultural expansion has occurred more recently, such as parts of Southeast Asia or South America, are more strongly represented within the typical 20-year assessment period. In contrast, in regions like Europe, where land conversion took place much earlier, these historical emissions may not be reflected in current results.
This raises an important question: to what extent are current methods truly comparable across regions? Areas with recent land conversion may appear as high emitters, while regions with older transformations may appear more favourable, even if their historical impacts were significant.